
 A Oneindia Venture


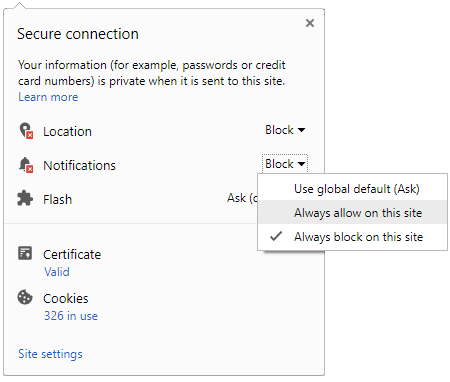
 Click it and Unblock the Notifications
LIC MF Nifty 50 Index Fund
3 Year Absolute Returns
17.06% ↑
NAV (₹) on 21 Oct 2026
46.51
1 Day NAV Change
-0.34%
Risk Level
Very High Risk
Rating
-
LIC MF Nifty 50 Index Fund is a Equity mutual fund categorized under Index, offered by LIC Mutual Fund Asset Management Limited. Launched on 14 Nov 2002, investors can start with a minimum SIP of ₹100 ... Read more
NAV History
Fund Details
Returns Calculator
Asset Allocation
AUM
₹ 345.29 Cr
Sector Holdings
| Sectors | Weightage |
|---|---|
| Finance - Banks - Private Sector | 25.73% |
| Refineries | 7.59% |
| IT Consulting & Software | 7.53% |
| Telecom Services | 5.10% |
| Construction, Contracting & Engineering | 4.21% |
| Auto - Cars & Jeeps | 4.01% |
| Finance - Banks - Public Sector | 3.79% |
| Non-Banking Financial Company (NBFC) | 3.78% |
| Pharmaceuticals | 3.28% |
| Iron & Steel | 2.60% |
| Cigarettes & Tobacco Products | 2.42% |
| Cement | 2.33% |
| E-Commerce/E-Retail | 2.21% |
| Auto - 2 & 3 Wheelers | 2.07% |
| Gems, Jewellery & Precious Metals | 1.81% |
| Personal Care | 1.60% |
| Power - Generation/Distribution | 1.47% |
| Hospitals & Medical Services | 1.46% |
| Aerospace & Defense | 1.33% |
| Port & Port Services | 1.32% |
| Aluminium | 1.30% |
| Finance - Life Insurance | 1.25% |
| Exchange Platform | 1.18% |
| Power - Transmission/Equipment | 1.12% |
| Airlines | 1.08% |
| Paints/Varnishes | 1.04% |
| Mining/Minerals | 0.98% |
| Holding Company | 0.96% |
| Trading & Distributors | 0.92% |
| Food Processing & Packaging | 0.89% |
| Retail - Apparel/Accessories | 0.83% |
| Oil Drilling And Exploration | 0.83% |
| Investment Company | 0.68% |
| Tea & Coffee | 0.59% |
| Auto - LCVs/HCVs | 0.57% |
| Treps/Reverse Repo | 0.20% |
Stock Holdings
| Name | Weightage | Value (in Cr.) | Sector |
|---|---|---|---|
| HDFC Bank Ltd. | 10.38% | ₹ 35.85 | Finance - Banks - Private Sector |
| ICICI Bank Ltd. | 9.05% | ₹ 31.26 | Finance - Banks - Private Sector |
| Reliance Industries Ltd. | 7.59% | ₹ 26.21 | Refineries |
| Bharti Airtel Ltd. | 5.10% | ₹ 17.62 | Telecom Services |
| Larsen & Toubro Ltd. | 4.21% | ₹ 14.53 | Construction, Contracting & Engineering |
| State Bank of India | 3.79% | ₹ 13.09 | Finance - Banks - Public Sector |
| Axis Bank Ltd. | 3.37% | ₹ 11.64 | Finance - Banks - Private Sector |
| Infosys Ltd. | 3.36% | ₹ 11.60 | IT Consulting & Software |
| Kotak Mahindra Bank Ltd. | 2.93% | ₹ 10.11 | Finance - Banks - Private Sector |
| Mahindra & Mahindra Ltd. | 2.52% | ₹ 8.71 | Auto - Cars & Jeeps |
| Bajaj Finance Ltd. | 2.47% | ₹ 8.54 | Non-Banking Financial Company (NBFC) |
| ITC Ltd. | 2.42% | ₹ 8.36 | Cigarettes & Tobacco Products |
| Eternal Ltd. | 2.21% | ₹ 7.64 | E-Commerce/E-Retail |
| Tata Consultancy Services Ltd. | 2.00% | ₹ 6.90 | IT Consulting & Software |
| Sun Pharmaceutical Industries Ltd. | 1.84% | ₹ 6.36 | Pharmaceuticals |
| Titan Company Ltd. | 1.81% | ₹ 6.26 | Gems, Jewellery & Precious Metals |
| Hindustan Unilever Ltd. | 1.60% | ₹ 5.52 | Personal Care |
| Maruti Suzuki India Ltd. | 1.49% | ₹ 5.13 | Auto - Cars & Jeeps |
| NTPC Ltd. | 1.47% | ₹ 5.07 | Power - Generation/Distribution |
| Tata Steel Ltd. | 1.47% | ₹ 5.06 | Iron & Steel |
| Bharat Electronics Ltd. | 1.33% | ₹ 4.58 | Aerospace & Defense |
| Adani Ports & Special Economic Zone Ltd. | 1.32% | ₹ 4.57 | Port & Port Services |
| Shriram Finance Ltd. | 1.31% | ₹ 4.53 | Non-Banking Financial Company (NBFC) |
| Hindalco Industries Ltd. | 1.30% | ₹ 4.50 | Aluminium |
| HCL Technologies Ltd. | 1.24% | ₹ 4.27 | IT Consulting & Software |
| Ultratech Cement Ltd. | 1.23% | ₹ 4.26 | Cement |
| BSE Ltd. | 1.18% | ₹ 4.08 | Exchange Platform |
| Bajaj Auto Ltd. | 1.13% | ₹ 3.92 | Auto - 2 & 3 Wheelers |
| JSW Steel Ltd. | 1.13% | ₹ 3.90 | Iron & Steel |
| Power Grid Corporation of India Ltd. | 1.12% | ₹ 3.88 | Power - Transmission/Equipment |
| Grasim Industries Ltd. | 1.10% | ₹ 3.81 | Cement |
| InterGlobe Aviation Ltd. | 1.08% | ₹ 3.74 | Airlines |
| Asian Paints Ltd. | 1.04% | ₹ 3.58 | Paints/Varnishes |
| Coal India Ltd. | 0.98% | ₹ 3.38 | Mining/Minerals |
| Bajaj Finserv Ltd. | 0.96% | ₹ 3.32 | Holding Company |
| Eicher Motors Ltd. | 0.94% | ₹ 3.26 | Auto - 2 & 3 Wheelers |
| Tech Mahindra Ltd. | 0.93% | ₹ 3.20 | IT Consulting & Software |
| Adani Enterprises Ltd. | 0.92% | ₹ 3.19 | Trading & Distributors |
| Nestle India Ltd. | 0.89% | ₹ 3.08 | Food Processing & Packaging |
| Oil & Natural Gas Corporation Ltd. | 0.83% | ₹ 2.88 | Oil Drilling And Exploration |
| Trent Ltd. | 0.83% | ₹ 2.87 | Retail - Apparel/Accessories |
| Apollo Hospitals Enterprise Ltd. | 0.80% | ₹ 2.76 | Hospitals & Medical Services |
| Cipla Ltd. | 0.72% | ₹ 2.49 | Pharmaceuticals |
| SBI Life Insurance Company Ltd. | 0.72% | ₹ 2.50 | Finance - Life Insurance |
| Dr. Reddy's Laboratories Ltd. | 0.72% | ₹ 2.49 | Pharmaceuticals |
| Jio Financial Services Ltd. | 0.68% | ₹ 2.34 | Investment Company |
| Max Healthcare Institute Ltd. | 0.66% | ₹ 2.27 | Hospitals & Medical Services |
| Tata Consumer Products Ltd. | 0.59% | ₹ 2.03 | Tea & Coffee |
| Tata Motors Passenger Vehicles Ltd. | 0.57% | ₹ 1.95 | Auto - LCVs/HCVs |
| HDFC Life Insurance Company Ltd. | 0.53% | ₹ 1.84 | Finance - Life Insurance |
| Treps | 0.20% | ₹ 0.68 | Others |
Returns
| Annualised returns | ||||
|---|---|---|---|---|
| 9M | 1Y | 2Y | 3Y | |
| Fund returns | -9.19% | -11.70% | -3.93% | 5.39% |
| Category returns | -3.01% | -3.91% | -0.24% | 15.69% |
Fund Objective
An open ended Index linked equity scheme seeking to provide capital growth by investing in index stocks.
AMC Details
Top Funds from Others - Index Funds/ETFs
|
Scheme Name
|
NAV
|
Returns
1Y
3Y
5Y
|
AUM (Cr)
|
Expense Ratio
|
Risk Meter
|
||
|---|---|---|---|---|---|---|---|
|
Mirae Asset NYSE FANG + ETF
ETF
Regular
|
₹174.86 | 23.35% | 188.48% | 204.17% | ₹4,448 | 0.66% |
Very High
|
|
Aditya Birla Sun Life Silver ETF
ETF
Regular
|
₹204.60 | 29.23% | 178.46% | 0.00% | ₹2,826 | 0.35% |
Very High
|
|
ICICI Prudential Silver ETF
ETF
Regular
|
₹204.46 | 29.18% | 178.35% | 0.00% | ₹14,341 | 0.40% |
Very High
|
|
Kotak Silver ETF
ETF
Regular
|
₹19.88 | 29.12% | 177.95% | 0.00% | ₹3,712 | 0.35% |
Very High
|
|
Mirae Asset Silver ETF
ETF
Regular
|
₹199.62 | 29.05% | 177.37% | 0.00% | ₹1,173 | 0.35% |
Very High
|
|
DSP Silver ETF
ETF
Regular
|
₹19.73 | 29.02% | 177.24% | 0.00% | ₹1,366 | N/A |
Very High
|
|
HDFC Silver ETF
ETF
Regular
|
₹195.85 | 28.54% | 176.96% | 0.00% | ₹7,724 | 0.50% |
Very High
|
|
Nippon India Silver ETF
ETF
Regular
|
₹195.90 | 28.85% | 176.10% | 0.00% | ₹31,196 | N/A |
Very High
|
|
UTI Silver Exchange Traded Fund
ETF
Regular
|
₹197.81 | 29.95% | 175.36% | 0.00% | ₹1,487 | 0.59% |
Very High
|
|
Axis Silver ETF
ETF
Regular
|
₹203.83 | 29.10% | 174.98% | 0.00% | ₹2,028 | 0.42% |
Very High
|
Top Funds from LIC Mutual Fund Asset Management Limited
|
Scheme Name
|
NAV
|
Returns
1Y
3Y
5Y
|
AUM (Cr)
|
Expense Ratio
|
Risk Meter
|
||
|---|---|---|---|---|---|---|---|
|
LIC MF Gold ETF
ETF
Regular
|
₹128.67 | 12.58% | 131.74% | 193.25% | ₹1,441 | 0.45% |
High
|
|
LIC MF Gold ETF FOF - Direct Plan
Fund of Funds
Direct
|
₹38.96 | 12.08% | 129.14% | 189.25% | ₹833 | 0.35% |
High
|
|
LIC MF Gold ETF FOF
Fund of Funds
Regular
|
₹36.82 | 11.77% | 126.59% | 183.71% | ₹833 | 0.61% |
High
|
|
LIC MF Infrastructure Fund - Direct Plan
Sector
Direct
|
₹59.23 | 2.86% | 74.07% | 148.41% | ₹1,153 | 1.33% |
Very High
|
|
LIC MF Infrastructure Fund - Direct Plan
Sector
Direct
|
₹58.15 | 2.86% | 73.97% | 147.39% | ₹1,153 | 1.33% |
Very High
|
|
LIC MF Infrastructure Fund - Direct Plan
Sector
Direct
|
₹58.15 | 2.86% | 73.97% | 147.39% | ₹1,153 | 1.33% |
Very High
|
|
LIC MF Healthcare Fund - Direct Plan
Sector
Direct
|
₹34.62 | 4.78% | 71.74% | 72.69% | ₹99 | 1.37% |
Very High
|
|
LIC MF Healthcare Fund - Direct Plan
Sector
Direct
|
₹34.61 | 4.78% | 71.69% | 72.64% | ₹99 | 1.37% |
Very High
|
|
LIC MF Healthcare Fund - Direct Plan
Sector
Direct
|
₹34.61 | 4.78% | 71.69% | 72.64% | ₹99 | 1.37% |
Very High
|
|
LIC MF Infrastructure Fund
Sector
Regular
|
₹50.94 | 1.49% | 67.30% | 133.44% | ₹1,153 | 2.67% |
Very High
|
FAQs
What is the current NAV of LIC MF Nifty 50 Index Fund Regular IDCW?
What is the fund size (AUM) of LIC MF Nifty 50 Index Fund Regular IDCW?
What are the historical returns of LIC MF Nifty 50 Index Fund Regular IDCW?
What is the risk level of LIC MF Nifty 50 Index Fund Regular IDCW?
What is the minimum investment amount for LIC MF Nifty 50 Index Fund Regular IDCW?
Disclaimer: This is 3rd Party content/feed, viewers are requested to use their discretion and conduct proper diligence before investing, GoodReturns does not take any liability on the genuineness and correctness of the information in this article
-
Block for 8 hours
-
Block for 12 hours
-
Block for 24 hours
-
Don't block

 Sign in with Google
- Male
- Female
- Others
- Under 18
- 18 to 25
- 26 to 35
- 36 to 45
- 45 to 55
- 55+