
 A Oneindia Venture


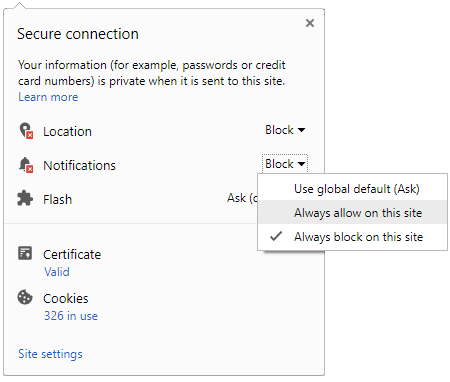
 Click it and Unblock the Notifications
Nippon India ETF Hang Seng BeES
3 Year Absolute Returns
68.48% ↑
NAV (₹) on 21 Oct 2026
424.47
1 Day NAV Change
-2.71%
Risk Level
Very High Risk
Rating
-
Nippon India ETF Hang Seng BeES is a Equity mutual fund categorized under ETF, offered by Nippon Life India Asset Management Ltd.. Launched on 15 Feb 2010, investors can start with a lumpsum ... Read more
NAV History
Fund Details
Returns Calculator
Asset Allocation
AUM
₹ 1,056.09 Cr
Sector Holdings
| Sectors | Weightage |
|---|---|
| Foreign Securities | 98.70% |
| Treps/Reverse Repo | 0.70% |
| Food Processing & Packaging | 0.37% |
| Current Assets | 0.23% |
Stock Holdings
| Name | Weightage | Value (in Cr.) | Sector |
|---|---|---|---|
| HSBC HOLDINGS PLC | 8.04% | ₹ 84.89 | Others |
| Tencent Holdings Ltd | 7.98% | ₹ 84.26 | Others |
| Alibaba Group Holding Limited | 7.89% | ₹ 83.32 | Others |
| China Construct BK-H | 5.66% | ₹ 59.80 | Others |
| AIA Group Ltd | 4.57% | ₹ 48.30 | Others |
| Industrial and Commercial Bank of China Ltd | 3.82% | ₹ 40.33 | Others |
| China Mobile Ltd | 2.97% | ₹ 31.42 | Others |
| Hong Kong Exchanges and Clearing Ltd | 2.81% | ₹ 29.63 | Others |
| Xiaomi Corporation | 2.74% | ₹ 28.90 | Others |
| Bank Of China Ltd | 2.60% | ₹ 27.44 | Others |
| Meituan | 2.39% | ₹ 25.27 | Others |
| Cnooc Ltd | 2.24% | ₹ 23.69 | Others |
| Ping An Insurance Group Co Of China Ltd | 2.12% | ₹ 22.43 | Others |
| Netease Inc | 2.04% | ₹ 21.51 | Others |
| BYD Company Limited - H shares | 1.67% | ₹ 17.66 | Others |
| BeOne Medicines Ltd | 1.64% | ₹ 17.33 | Others |
| Semiconductor Manufacturing International Corp | 1.64% | ₹ 17.35 | Others |
| Lenovo Group Ltd | 1.54% | ₹ 16.31 | Others |
| WuXi Biologics (Cayman) Inc. | 1.33% | ₹ 13.99 | Others |
| China Life Insurance Co Ltd | 1.26% | ₹ 13.27 | Others |
| Petrochina Company Ltd | 1.22% | ₹ 12.94 | Others |
| China Merchants Bank Co. Ltd. - H Shares | 1.21% | ₹ 12.75 | Others |
| BOC Hong Kong Holdings Ltd | 1.16% | ₹ 12.26 | Others |
| Zijin Mining Group Co Ltd | 1.16% | ₹ 12.25 | Others |
| Techtronic Industries Co Ltd. | 1.13% | ₹ 11.97 | Others |
| CK Hutchison Holdings Limited | 1.11% | ₹ 11.67 | Others |
| Innovent Biologics Inc | 0.97% | ₹ 10.27 | Others |
| JD.com Inc | 0.97% | ₹ 10.26 | Others |
| Sun Hung Kai Properties | 0.94% | ₹ 9.97 | Others |
| China Shenhua - H | 0.85% | ₹ 9.03 | Others |
| Baidu Inc | 0.81% | ₹ 8.52 | Others |
| CLP Holdings Ltd | 0.76% | ₹ 7.99 | Others |
| Triparty Repo | 0.70% | ₹ 7.37 | Others |
| Pop Mart International Group Limited | 0.67% | ₹ 7.09 | Others |
| Trip.com Group Ltd | 0.64% | ₹ 6.80 | Others |
| Anta Sports Products Limited | 0.62% | ₹ 6.54 | Others |
| China Petroleum -H- | 0.60% | ₹ 6.33 | Others |
| Contemporary Amperex Technology Co. Limited | 0.60% | ₹ 6.37 | Others |
| WuXi AppTec Co.Limited | 0.60% | ₹ 6.36 | Others |
| China Resources Land Ltd | 0.59% | ₹ 6.22 | Others |
| Link REIT NPV | 0.58% | ₹ 6.13 | Others |
| Geely Auto | 0.57% | ₹ 5.97 | Others |
| Kuaishou Technology | 0.56% | ₹ 5.94 | Others |
| CK Asset Holdings Limited | 0.54% | ₹ 5.71 | Others |
| Hua Hong Semiconductor Ltd | 0.51% | ₹ 5.34 | Others |
| Power Assets Holdings Ltd | 0.50% | ₹ 5.24 | Others |
| CSPC Pharmaceutical Group Limited | 0.49% | ₹ 5.15 | Others |
| The Hong Kong China Gas Company Limited | 0.48% | ₹ 5.05 | Others |
| Nongfu Spring Co. Limited | 0.48% | ₹ 5.09 | Others |
| Citic Ltd | 0.46% | ₹ 4.84 | Others |
| China Hongqiao Group Limited | 0.44% | ₹ 4.70 | Others |
| Li Auto Inc | 0.37% | ₹ 3.90 | Others |
| Galaxy Entertainment Group Ltd | 0.37% | ₹ 3.95 | Food Processing & Packaging |
| MTR Corp Limited | 0.36% | ₹ 3.84 | Others |
| China Telecom Corp Ltd | 0.36% | ₹ 3.76 | Others |
| ZTO Express (Cayman) Inc | 0.35% | ₹ 3.74 | Others |
| J&T Global Express Limited | 0.35% | ₹ 3.71 | Others |
| Sino Biopharmaceutical Ltd | 0.35% | ₹ 3.73 | Others |
| Weichai Power | 0.34% | ₹ 3.54 | Others |
| China Molybdenum-H | 0.34% | ₹ 3.59 | Others |
| Midea Group Co Ltd | 0.34% | ₹ 3.60 | Others |
| China Mengniu Dairy Co | 0.33% | ₹ 3.51 | Others |
| WH Group Limited | 0.33% | ₹ 3.50 | Others |
| Hansoh Pharmaceutical Group Company Limited | 0.32% | ₹ 3.39 | Others |
| Wharf Real Estate Investment Company Ltd | 0.31% | ₹ 3.23 | Others |
| China Overseas Land & Investment Ltd | 0.30% | ₹ 3.20 | Others |
| Haier Smart Home Co Ltd | 0.29% | ₹ 3.11 | Others |
| Sunny Optical Tech | 0.27% | ₹ 2.82 | Others |
| CK Infrastructure Holdings Ltd | 0.25% | ₹ 2.61 | Others |
| China Resources Power Holdings Co Limited | 0.25% | ₹ 2.60 | Others |
| JD Health International Inc | 0.24% | ₹ 2.57 | Others |
| Net Current Assets | 0.23% | ₹ 1.88 | Others |
| ENN Energy Holdings Limited | 0.23% | ₹ 2.45 | Others |
| Henderson Land Development Co Limited | 0.23% | ₹ 2.46 | Others |
| New Oriental Education & Technology Group Inc | 0.22% | ₹ 2.33 | Others |
| China Unicom Hong Kong Ltd | 0.20% | ₹ 2.12 | Others |
| China Resources Beer (Holdings) Company Limited | 0.18% | ₹ 1.93 | Others |
| Shenzhou International Group Holdings Ltd | 0.17% | ₹ 1.83 | Others |
| Sands China Ltd | 0.17% | ₹ 1.83 | Others |
| Aluminum Corporation of China Ltd | 0.17% | ₹ 1.84 | Others |
| Li Ning Company Limited | 0.17% | ₹ 1.84 | Others |
| China Resources Mixc Lifestyle Services Limited | 0.16% | ₹ 1.66 | Others |
| JD Logistics Inc | 0.16% | ₹ 1.70 | Others |
| Tingyi (Cayman Islands) Holdings Corp | 0.14% | ₹ 1.45 | Others |
| Chow Tai Fook Jewellery Group Limited | 0.13% | ₹ 1.37 | Others |
| Laopu Gold Co. Ltd | 0.13% | ₹ 1.37 | Others |
| Sinopharm Group Co Ltd | 0.12% | ₹ 1.26 | Others |
| Xinyi Glass Holdings Ltd | 0.11% | ₹ 1.14 | Others |
| Alibaba Health Information Technology Ltd | 0.11% | ₹ 1.18 | Others |
| BYD Electronic International Co Ltd | 0.11% | ₹ 1.15 | Others |
| Orient Overseas (International) Limited | 0.11% | ₹ 1.20 | Others |
| Haidilao International Holding Ltd | 0.11% | ₹ 1.15 | Others |
| Hengan International Group Co Ltd | 0.08% | ₹ 0.79 | Others |
| Longfor Group Holdings Ltd | 0.08% | ₹ 0.90 | Others |
| Budweiser Brewing Company APAC Limited | 0.07% | ₹ 0.75 | Others |
| Hang Lung Properties Ltd | 0.07% | ₹ 0.77 | Others |
| Xinyi Solar Holdings Limited | 0.05% | ₹ 0.57 | Others |
Returns
| Annualised returns | ||||
|---|---|---|---|---|
| 9M | 1Y | 2Y | 3Y | |
| Fund returns | -7.04% | -0.56% | 15.87% | 18.99% |
| Category returns | -3.01% | -3.91% | -0.24% | 15.69% |
Fund Objective
The investment objective of the Scheme is to provide returns that, before expenses, closely correspond to the total returns of securities as represented by Hang Seng Index of Hang Seng Data Services ... Read more
AMC Details
Top Funds from Others - Index Funds/ETFs
|
Scheme Name
|
NAV
|
Returns
1Y
3Y
5Y
|
AUM (Cr)
|
Expense Ratio
|
Risk Meter
|
||
|---|---|---|---|---|---|---|---|
|
Mirae Asset NYSE FANG + ETF
ETF
Regular
|
₹174.86 | 23.35% | 188.48% | 204.17% | ₹4,448 | 0.66% |
Very High
|
|
Aditya Birla Sun Life Silver ETF
ETF
Regular
|
₹204.60 | 29.23% | 178.46% | 0.00% | ₹2,826 | 0.35% |
Very High
|
|
ICICI Prudential Silver ETF
ETF
Regular
|
₹204.46 | 29.18% | 178.35% | 0.00% | ₹14,341 | 0.40% |
Very High
|
|
Kotak Silver ETF
ETF
Regular
|
₹19.88 | 29.12% | 177.95% | 0.00% | ₹3,712 | 0.35% |
Very High
|
|
Mirae Asset Silver ETF
ETF
Regular
|
₹199.62 | 29.05% | 177.37% | 0.00% | ₹1,173 | 0.35% |
Very High
|
|
DSP Silver ETF
ETF
Regular
|
₹19.73 | 29.02% | 177.24% | 0.00% | ₹1,366 | N/A |
Very High
|
|
HDFC Silver ETF
ETF
Regular
|
₹195.85 | 28.54% | 176.96% | 0.00% | ₹7,724 | 0.50% |
Very High
|
|
Nippon India Silver ETF
ETF
Regular
|
₹195.90 | 28.85% | 176.10% | 0.00% | ₹31,196 | N/A |
Very High
|
|
UTI Silver Exchange Traded Fund
ETF
Regular
|
₹197.81 | 29.95% | 175.36% | 0.00% | ₹1,487 | 0.59% |
Very High
|
|
Axis Silver ETF
ETF
Regular
|
₹203.83 | 29.10% | 174.98% | 0.00% | ₹2,028 | 0.42% |
Very High
|
Top Funds from Nippon Life India Asset Management Ltd.
|
Scheme Name
|
NAV
|
Returns
1Y
3Y
5Y
|
AUM (Cr)
|
Expense Ratio
|
Risk Meter
|
||
|---|---|---|---|---|---|---|---|
|
Nippon India Taiwan Equity fund - Direct Plan
Sector
Direct
|
₹34.47 | 97.94% | 295.52% | 0.00% | ₹1,147 | 1.06% |
Very High
|
|
Nippon India Taiwan Equity fund - Direct Plan
Sector
Direct
|
₹34.47 | 97.94% | 295.52% | 0.00% | ₹1,147 | 1.06% |
Very High
|
|
Nippon India Taiwan Equity fund - Direct Plan
Sector
Direct
|
₹34.47 | 97.94% | 295.52% | 0.00% | ₹1,147 | 1.06% |
Very High
|
|
Nippon India Taiwan Equity Fund
Sector
Regular
|
₹32.14 | 95.31% | 279.57% | 0.00% | ₹1,147 | 2.34% |
Very High
|
|
Nippon India Taiwan Equity Fund
Sector
Regular
|
₹32.14 | 95.31% | 279.57% | 0.00% | ₹1,147 | 2.34% |
Very High
|
|
Nippon India Taiwan Equity Fund
Sector
Regular
|
₹32.14 | 95.31% | 279.57% | 0.00% | ₹1,147 | 2.34% |
Very High
|
|
Nippon India Silver ETF
ETF
Regular
|
₹195.90 | 28.85% | 176.10% | 0.00% | ₹31,196 | N/A |
Very High
|
|
Nippon India Silver ETF FOF - Direct Plan
Fund of Funds
Direct
|
₹31.07 | 30.03% | 171.12% | 0.00% | ₹4,354 | 0.22% |
Very High
|
|
Nippon India Silver ETF FOF - Direct Plan
Fund of Funds
Direct
|
₹31.07 | 30.03% | 171.12% | 0.00% | ₹4,354 | 0.22% |
Very High
|
|
Nippon India Silver ETF FOF - Direct Plan
Fund of Funds
Direct
|
₹31.07 | 30.03% | 171.12% | 0.00% | ₹4,354 | 0.22% |
Very High
|
FAQs
What is the current NAV of Nippon India ETF Hang Seng BeES Regular Growth?
What is the fund size (AUM) of Nippon India ETF Hang Seng BeES Regular Growth?
What are the historical returns of Nippon India ETF Hang Seng BeES Regular Growth?
What is the risk level of Nippon India ETF Hang Seng BeES Regular Growth?
What is the minimum investment amount for Nippon India ETF Hang Seng BeES Regular Growth?
Disclaimer: This is 3rd Party content/feed, viewers are requested to use their discretion and conduct proper diligence before investing, GoodReturns does not take any liability on the genuineness and correctness of the information in this article
-
Block for 8 hours
-
Block for 12 hours
-
Block for 24 hours
-
Don't block

 Sign in with Google
- Male
- Female
- Others
- Under 18
- 18 to 25
- 26 to 35
- 36 to 45
- 45 to 55
- 55+